Bar Plot
df.plot(kind='bar', x=data_col, y=data_col)
Creates a bar plot using a DataFrame.
- Input:
- kind : string
- To create a bar plot, use kind='bar'
- To create a horizontal bar plot, use kind='barh'
- x : label, optional
- Column containing categorical data for group labels. If not specified, the index of the DataFrame is used.
- y : label, optional
- Column containing numerical data for the groups in x. If not specified, all numerical columns are used.
- Returns:
- Matplotlib plot created using parameters.
- Return Type:
- Matplotlib plot
- Note:
- When kind='bar', you can sort your DataFrame in descending order by your y column before plotting to create a vertical bar plot that goes from tall to short, left to right.
- When kind='barh', you can sort your DataFrame in ascending order by your y column before plotting to create a horizontal bar plot that goes from tall to short, top to bottom.
# Creating a DataFrame to use for bar plots below
avg_species_weights = pets.get(['Species', 'Weight']).groupby('Species').mean().reset_index()
avg_species_weights
| Index | Species | Weight |
|---|---|---|
| 0 | cat | 8.8333333333 |
| 1 | dog | 48.3333333333 |
| 2 | hamster | 0.625 |
avg_species_weights.sort_values(by='Weight', ascending=False).plot(kind='bar', x='Species', y='Weight')
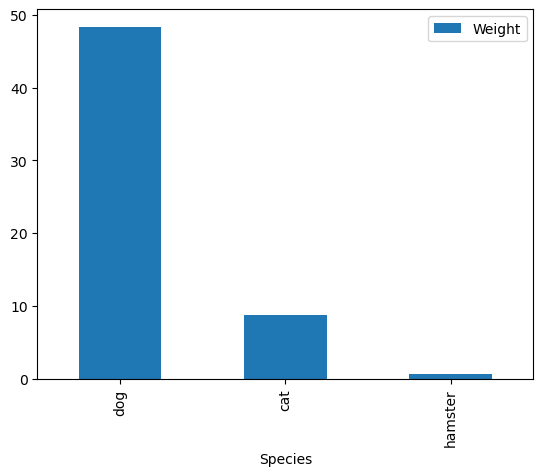
If the group label is the index of the DataFrame, the x parameter can be omitted.
# Creating a DataFrame to use for bar plots below
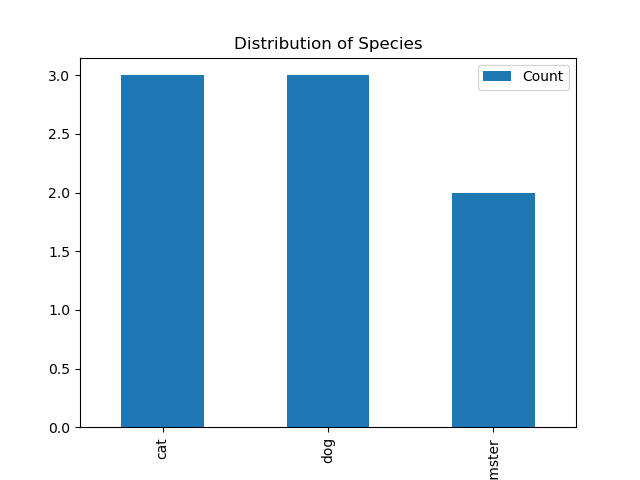
species_count = pets.get(['Species','ID']).groupby('Species').count()
species_count = species_count.assign(Count = species_count.get('ID')).drop(columns = ['ID'])
species_count
| Index | Count |
|---|---|
| cat | 3 |
| dog | 3 |
| hamster | 2 |
species_count.plot(kind='bar', y='Count', title='Distribution of Species');
avg_species_weights.sort_values(by='Weight', ascending=True).plot(kind='barh', x='Species', y='Weight')

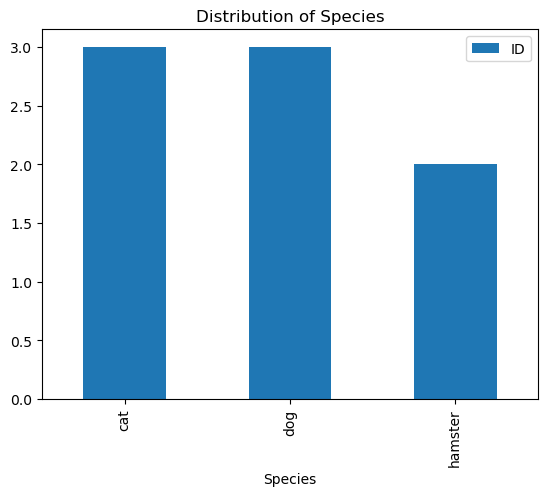
pets.groupby('Species').count().plot(kind='bar', y='ID', title='Distribution of Species')
See Also
Histogram · [Scatter Plot](../plotting/Scatter Plot.md) · df.groupby() · df.sort_values()
Problems or suggestions about this page? Fill out our feedback form.